
AS Sure Investment Services, in collaboration with Optimum Investment Group, enable our clients to have access to a well-versed investment team with extensive experience in both local and global asset management, which allows clients to grow their wealth and meet their investment objectives. This document outlines financial market movements as well as the effects it had on the AS Forum Funds.
March 2026
March marked a sharp reversal in risk sentiment. Global markets endured their weakest month in several years as the escalation of the United States-Israel conflict with Iran triggered a major energy shock and pushed investors into a broad “risk‑off” positioning. The effective closure of the Strait of Hormuz dramatically raised the probability of sustained supply disruption, sending oil prices sharply higher and forcing markets to reprice the path of inflation and interest rates. Global equities and bonds declined together, while the US dollar strengthened as investors sought safety.
South African markets were not spared. After a strong start to the year, the local bourse suffered its worst monthly drawdown in many years as the sell‑off in precious metals and rising inflation concerns hit both equities and bonds. The rand weakened sharply, adding to volatility across local assets.
LOCAL MARKETS
Exhibit 1 | Local Performance (ZAR) for March 2026
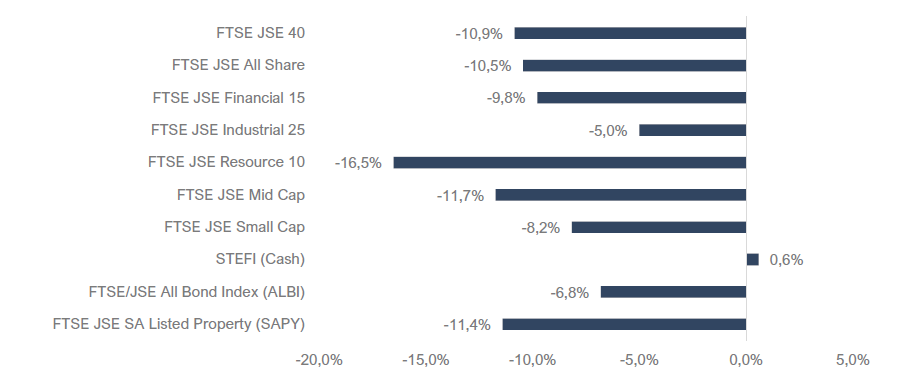
Source: Factset. Data as at 31 March 2026. Past performance is not indicative of future performance. For illustrative purposes only and not indicative of any investment.
South Africa
Economy
South Africa’s inflation data looked benign on the surface, but it is best viewed as a “before the shock” snapshot. Headline CPI eased to 3.0% year‑on‑year in February, while core inflation also moderated to around 3.0%, consistent with the SARB’s newly adopted 3% inflation objective. However, the surge in oil prices during March materially shifted the inflation risk profile to the upside, raising the likelihood of higher fuel‑driven inflation in the coming months.
Against this shifting backdrop, the South African Reserve Bank kept the repo rate unchanged at 6.8% at its March meeting, adopting a cautious stance amid heightened global volatility and rising energy‑price risks. The key message for markets was clear: policy is likely to remain tighter for longer while the inflation impact of higher oil prices becomes clearer.
Equity Markets
South African equities suffered a sharp reversal in March. The FTSE/JSE All Share Index (ALSI) fell approximately 10.5%, ending a long streak of positive monthly returns and marking one of the market’s worst monthly drawdowns in many years.
Sector performance remained highly differentiated:
- Resources declined sharply (around ‑5%), as the sell‑off in precious metals and PGMs hit miners hard, even though select energy‑linked counters benefited from the oil shock.
- Financials fell roughly ‑8%, as banks and insurers were repriced for higher inflation risk, higher long‑bond yields and increased macro uncertainty.
- Listed property retreated materially (around ‑4%), reflecting the sharp move higher in bond yields and the broader risk‑off environment.
- Industrials were comparatively resilient but still declined (around ‑0%), pressured by weaker global growth expectations and broad de‑risking.
Performance at the stock level was split between energy beneficiaries and precious‑metal casualties. Energy and coal‑linked names rallied strongly, while gold and PGM miners were among the hardest hit as gold and platinum prices fell and rate expectations shifted higher.
Best performers:
Sasol Ltd | 55.0%
Glencore Plc | 11.8%
Shoprite Holdings | 5.4%
British American Tobacco | 1%
BID Corp Ltd | -1.5%
Worst performers:
Implats | -31.2%
Harmony Gold Mining | -28.7%
Sibanye Stillwater Ltd | -25.2%
Valterra Platinum Ltd | -22.6%
Northam Platinum | -19.9%
Bond Market and Currency
Local bonds experienced a major repricing. The FTSE/JSE All Bond Index (ALBI) fell -6.8% in March, making it one of the worst months on record for the asset class. Inflation-linked bonds also declined, with the CILI down -5.7%. The sell-off was driven by a sharp jump in yields as investors priced in higher near-term inflation, reduced probability of rate cuts, and increased risk premiums.
The move in rates was dramatic: the S.A. 10-year yield rose meaningfully into month-end (around 9.3% in one market summary), reflecting both local and global forces.
The rand weakened sharply and was among the poorest-performing major currencies for the month. The USD/ZAR depreciated by -7.6% to end near R17.15, amplifying imported inflation risks and contributing to the negative sentiment across domestic assets.
GLOBAL MARKETS
Global markets reversed sharply in March as the Middle East conflict escalated into an energy shock. The resulting surge in oil prices pushed inflation fears higher and forced investors to reassess the timing of future rate cuts. This “inflation versus growth” clash weighed on risk assets broadly, leading to simultaneous declines in equities and bonds, while the US dollar strengthened and volatility increased.
Exhibit 2 | Global Performance (base currency) March 2026
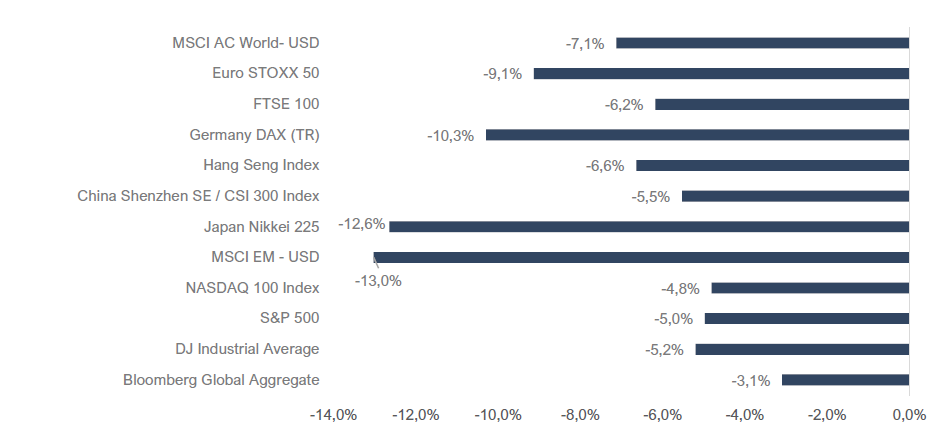
Source: Factset. Data as at 31 March 2026. Past performance is not indicative of future performance. For illustrative purposes only and not indicative of any investment.
United States
US equities fell into correction territory during March before a late‑month rally reduced losses somewhat. The S&P 500 declined about ‑5.0%, the Nasdaq fell roughly ‑4.8%, and the Dow Jones dropped around ‑5.2%, ending a long winning streak.
The US Federal Reserve kept rates on hold at its March meeting, highlighting heightened uncertainty and the inflation risks associated with the oil price shock. Treasury yields moved higher, with the US 10‑year yield rising to roughly 4.3%, as markets pared back expectations of near‑term easing.
Europe
Europe was among the hardest hit regions, given its energy sensitivity. Major indices fell sharply, with the Euro Stoxx 50 down -9.1%, France’s CAC down -9.0%, and Germany’s DAX down -10.3% during the month. Eurozone inflation also surprised to the upside (around 1.9% in February versus 1.7% previously), further complicating the policy outlook as energy costs surged.
United Kingdom
UK equities also declined, though the market’s commodity exposure provided partial insulation. The FTSE 100 fell around ‑6.0% in March. UK growth remained soft (with the 2025 fourth quarter GDP around 0.1%), while inflation stayed elevated around 3%, leaving the Bank of England (BoE) cautious as the energy shock threatened to add new pressure.
Asia
Asia was broadly weaker, with outcomes reflecting varying energy dependence. Japan’s Nikkei was particularly hard hit (around ‑12.6%), consistent with its reliance on imported energy. China’s major indices also ended lower, though the region benefited somewhat from reduced reliance on Hormuz‑linked supply and improving domestic activity indicators. China’s official PMIs returned to expansion, with manufacturing rising above 50.
Emerging Markets (EM)
Emerging markets underperformed sharply in March as risk appetite deteriorated. The MSCI Emerging Markets Index fell around ‑13%, reversing much of the relative strength seen earlier in the year. EM assets were hit by the combination of higher oil prices (a negative for most oil‑importing EMs), tighter global financial conditions, and a stronger US dollar.
Commodities and Currencies
March was dominated by the oil shock. Brent crude surged above US$100/barrel during the month and ended materially higher, driven by disruption fears around the Strait of Hormuz. This supported energy equities, which were the standout winners within otherwise weak global equity markets.
In contrast, gold declined sharply (around ‑11.0% to ‑12.0%) as a stronger US dollar and rising real yields reduced the appeal of non‑yielding safe havens, despite elevated geopolitical risk. Platinum Group Metals (PGMs) also retreated materially in the month, amplifying the drawdown in South African precious‑metal miners. The US Dollar Index strengthened (around +2.4%), reflecting a classic flight‑to‑safety dynamic in global markets.
Outlook
March was a reminder of how quickly macro narratives can shift. Markets entered the month expecting gradual disinflation and eventual policy easing, but the escalation in the Middle East delivered a large energy shock that forced an abrupt repricing of inflation risk, growth expectations and the timing of rate cuts. The result was a rare but powerful combination: equities and bonds declining together, higher volatility, and a stronger US dollar.
For South Africa, the key near‑term swing factor is whether elevated oil prices persist long enough to feed meaningfully into domestic inflation and policy expectations. While February inflation prints were consistent with the SARB’s 3.0% target, those readings likely represent the last “clean” inflation signal before fuel‑driven pressure becomes visible in the data.
At the same time, March’s market action reinforced the importance of diversification within equities: energy and coal‑linked businesses benefited substantially from the shock, while precious‑metal miners and rate‑sensitive sectors experienced steep drawdowns. With cross‑asset volatility elevated and policy visibility reduced, maintaining balanced exposures and avoiding concentrated bets remains essential.
Performance Review | March 2026
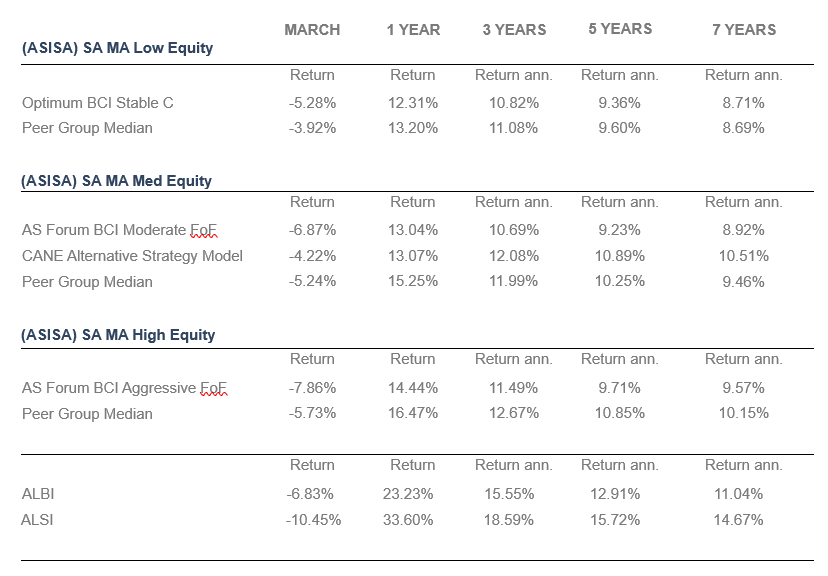
Source: OIG, FundFocus. Data as at 31 March 2026. Past performance is not indicative of future performance.
Disclaimer
Although reasonable steps have been taken to ensure the validity and accuracy of the information in this document, Optimum Investment Group (OIG) does not accept any responsibility for any claim, damages, loss or expense, however, it arises, out of or in connection with the information in this document, whether by a client, investor or intermediary.
Optimum Investment Group (Pty) Ltd. Is an Authorised Financial Services Provider (43488).
All investments involve risk, including the potential loss of principal. There is no assurance that any financial strategy will be successful. OIG does not guarantee that the results of any advice, recommendations, or strategies will be achieved. Before making any investment decisions, customers should thoroughly review all relevant investment product documents and information. It is essential to assess whether an investment aligns with your financial situation, objectives, and risk profile.
This document may contain forward-looking statements identified by terms such as “expects,” “anticipates,” “believes,” “estimates,” “forecasts,” and similar expressions. These statements involve risks, uncertainties, and other factors that could cause actual results to differ materially from those projected. OIG is not responsible for any trading decisions, damages, or other losses resulting from the use of the information, data, analyses, or opinions provided. Past performance does not guarantee future results. Neither diversification nor asset allocation ensures a profit or protects against a loss. The information, data, analyses, and opinions presented herein are for informational purposes only and do not constitute investment advice or an offer to buy or sell any security. References to specific securities or investment options should not be considered an offer to purchase or sell those investments. The performance data shown reflects past performance and is not indicative of future results. The opinions expressed are those of OIG as of the date written, are subject to change without notice, and do not constitute investment advice.