Monthly macro and economic insights report
Our monthly To the Point column by economist Dr Roelof Botha offers in-depth analysis and commentary on the latest economic trends, market developments, and financial news. Designed to keep you informed and ahead of the curve, each edition delves into key economic indicators, explores their impact on global and local markets, and provides insights to help you navigate the ever-changing economic landscape.
March 2026
Bond yield at 8-year low
South Africa’s 10-year government bond yield (which serves as the country’s benchmark long-term interest rate) has declined by 313 basis points since 4 April last year. Over the same period, the decline in the prime overdraft rate was only 100 basis points – an indication that the Reserve Bank’s rate-cutting cycle is bound to continue.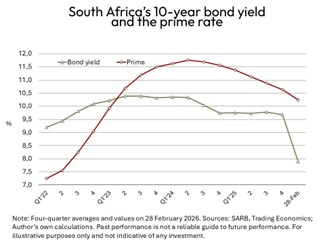
Substantial empirical research has been conducted that confirms a positive correlation over the long term between a country’s benchmark bond yield and its benchmark lending rate (in South Africa’s case, the prime rate). Deviations from this relationship usually only occur during extraordinary circumstances, as experienced in the aftermath of the COVID-19 pandemic and Russia’s military invasion of Ukraine.
These events led to an eight-fold increase in global freight shipping rates and a five-fold increase in the price of Brent crude oil, which predictably caused a spike in global inflation, with most central banks opting to raise interest rates.
Now that a large measure of price stability has returned to South Africa and its key trading partners, monetary policy has become more accommodating, prospects for higher economic growth have improved, and a larger measure of fiscal stability has become evident. South Africa is in the process of being rewarded for several impressive achievements over the past year, starting with the compromise on last year’s budget reached within the Government of National Unity.
Other reasons for the newfound demand for South Africa’s sovereign bonds include:
- A fairly stable annualised rate of increase in the consumer price index of around 3.5%
- Expectations of GDP growth of between 1.5% and 2% in 2026
- Progress with lowering the fiscal deficit/GDP ratio
- South Africa’s removal from the so-called ‘grey list’ of the Financial Action Task Force
- The recent sovereign credit upgrade by S&P Global
- Sustained surpluses on both the trade account and the financial account of the balance of payments maintaining fiscal stability.
Business confidence on the march
The Business Confidence Index (BCI) of the South African Chamber of Commerce and Industry’s (Sacci) maintained an upward momentum during 2025, reaching an average of 121.7 for 2025. This is the highest annual average recorded since 2013, when the BCI measured 122.2 (with 2020’s average equal to 100).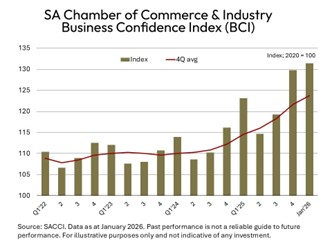
Despite edging down marginally to 131.4 in January 2026 from 133.2 in December 2025, the business chamber emphasised that sentiment stayed elevated after a notable improvement in 2025. The monthly decline in January has been attributed to some weakness in manufacturing, merchandise exports and vehicle sales, with the latter representing a long-standing downward cyclical trend following the summer holiday season.
According to the chamber, the exceptionally strong increase in business confidence towards the end of 2025 and into 2026 provides an important opportunity to convert positive business sentiment into measures aimed at lifting South Africa’s ratio of fixed investment to GDP, which remains much lower than the world average.
Importantly, the results of the Sacci BCI are in line with the recent uptick in the S&P Global purchasing managers’ index (PMI) for South Africa, as well as the Reserve Bank’s leading business cycle indicator. The latter took a hit in 2022 and 2023, mainly due to high interest rates, but then started improving to record a year-on-year increase of 3.2% in 2025.
New record for top six mineral sales
The surge in precious metal prices has led to a new record high for the sales values of South Africa’s top six minerals, which amounted to R784 billion during 2025. With the current high level of geopolitical uncertainty and wars raging in Ukraine and in the Middle East, the demand for precious metals as a safe-haven asset, especially gold, is likely to remain in place for quite some time.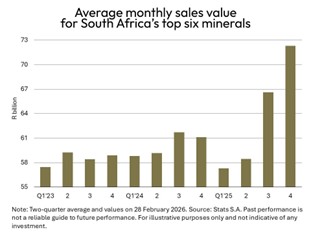
Over the past two years, many central banks and institutional investors have turned to gold, which rose to an all-time high of above $5,400 per ounce at the end of January. Against the background of the turmoil in the Middle East and US Treasury yields having declined to below 4% for the first time since September 2024, gold should retain its allure.
Last year, the high prices for precious metals secured a year-on-year increase of 8% in the combined value of the six largest contributors to South Africa’s mineral sales, which has undoubtedly played a key role in the ability of the National Treasury to provide significant tax relief to individuals in the 2026/27 budget, tabled at the end of February. It has also boosted the country’s export earnings at a time when international trade relations have become increasingly uncertain as a result of changes to tariff regimes by the US and a flood of relatively cheap exports from China.
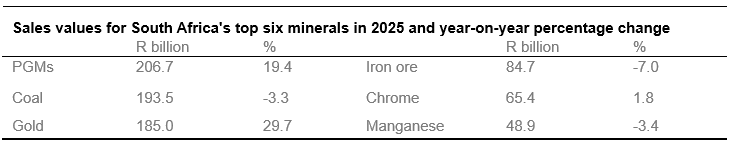
Notes: Ranked by sales values; Total = R784.2 billion.
Sources: Stats SA; own calculations. Past performance is not a reliable guide to future performance. For illustrative purposes only and not indicative of any investment.
Forex data points to imminent rand retreat
Over the past 14 months, the strength of the South African rand has continued to baffle foreign exchange dealers, with a rather predictable increase in the ratio between values for spot and forward exchange transactions against the rand. As a rule of thumb, higher volumes in the spot market for foreign exchange relative to the forward market indicate a higher level of uncertainty over the longer-term value of a currency.
In the case of the rand, this ratio has increased from a quarterly average of 1.66 during the third quarter of 2019 to 3.51 at the end of 2025 – an increase of more than 100%. Although an increase in this ratio is often linked to higher trading activity on the current and financial accounts of the balance of payments, a sustained increase to a higher level is often an indicator of an imminent weakening of a currency.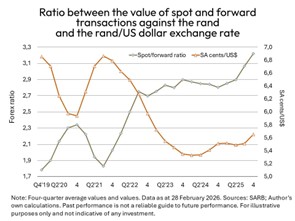
The exceptional volatility in the rand that accompanied the damage inflicted on the South African economy by state capture and the political uncertainty surrounding the election of President Ramaphosa as head of state in 2018 caused a deviation from the traditional inverse relationship between the value of a currency and the ratio between its spot and forward transactions.
The latter causality was restored in 2019, but the most recent surge in the value of the rand has defied theory, suggesting that the rand is bound for a correction to a more accurate value. According to research by Currencies Direct, the rand was overvalued by 13% against the US dollar at the end of February. Since then, however, the outbreak of war in the Middle East has caused the rand to depreciate sharply against the greenback – in line with most global currencies. Hopefully, the hostilities will not last too long, after which fundamentals will return to the foreign exchange
About Dr Roelof Botha
A seasoned veteran of the economics fraternity in South Africa, Dr Botha has more than 50 years’ experience as a lecturer, financial editor of a daily newspaper, economic policy advisor at the National Treasury, columnist for various publications, researcher and a public speaker. Dr Botha received his early schooling in Sweden, Germany, The Netherlands, Christiana in the North West Province, as well as in Cape Town and Pretoria. Shorten with AI
His post-graduate qualifications include Honours and master’s degrees in economics (cum laude) at the University of Pretoria, and a Doctorate at the University of Johannesburg. He has authored more than 2000 articles, research papers and books, and has received the prestigious Finmedia Economist of the Year award, based on the accuracy of forecasts of key economic indicators.Shorten with AI
Dr Botha teaches economics (part-time) at the Gordon Institute of Business Science (GIBS) and is the Economic Advisor to the Optimum Financial Services Group.
Disclaimer
Although reasonable steps have been taken to ensure the validity and accuracy of the information in this document, Optimum Investment Group (OIG) does not accept any responsibility for any claim, damages, loss or expense, however, it arises, out of or in connection with the information in this document, whether by a client, investor or intermediary.
Optimum Investment Group (Pty) Ltd. Is an Authorised Financial Services Provider (43488).
All investments involve risk, including the potential loss of principal. There is no assurance that any financial strategy will be successful. OIG does not guarantee that the results of any advice, recommendations, or strategies will be achieved. Before making any investment decisions, customers should thoroughly review all relevant investment product documents and information. It is essential to assess whether an investment aligns with your financial situation, objectives, and risk profile.
This document may contain forward-looking statements identified by terms such as “expects,” “anticipates,” “believes,” “estimates,” “forecasts,” and similar expressions. These statements involve risks, uncertainties, and other factors that could cause actual results to differ materially from those projected. OIG is not responsible for any trading decisions, damages, or other losses resulting from the use of the information, data, analyses, or opinions provided.
Past performance does not guarantee future results. Neither diversification nor asset allocation ensures a profit or protects against a loss.
The information, data, analyses, and opinions presented herein are for informational purposes only and do not constitute investment advice or an offer to buy or sell any security. References to specific securities or investment options should not be considered an offer to purchase or sell those investments. The performance data shown reflects past performance and is not indicative of future results.
The opinions expressed are those of OIG as of the date written, are subject to change without notice, and do not constitute investment advice.