
Monthly macro and economic insights report
Our monthly To the Point column by economist Dr Roelof Botha offers in-depth analysis and commentary on the latest economic trends, market developments, and financial news. Designed to keep you informed and ahead of the curve, each edition delves into key economic indicators, explores their impact on global and local markets, and provides insights to help you navigate the ever-changing economic landscape.
January 2026
Rand ends 2025 on a high note
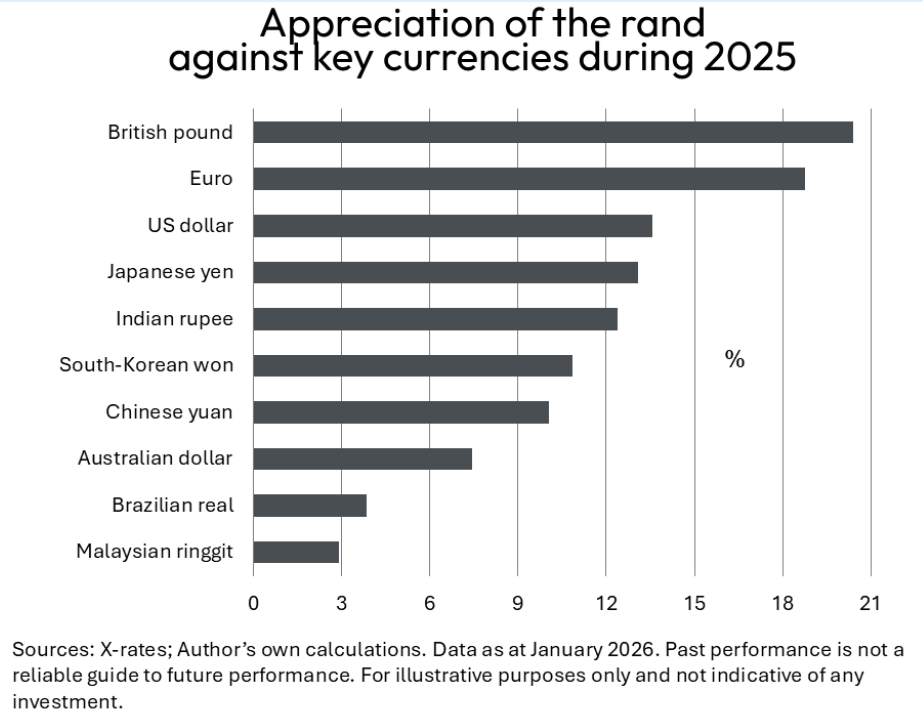
South Africa’s currency continued to flex its muscles against the US dollar and its emerging market (EM) peers during December. The rand outperformed all of the 16 key currencies [1]. The month-on-month appreciation of 3.2% took the year-on-year strengthening against the US dollar to 13.8%. The rand’s strength during 2025 was not limited to the US dollar, with significant gains against virtually all the key currencies of the EMs and the advanced economies of the world.
One explanation for the sterling performance of the South African currency is the traditional positive relationship with the gold price – a trend that has existed for the better part of the past eight decades. Another reason can be found in the solid performance of the South African balance of payments, with both the trade account and the financial account having produced sizeable surpluses over the past two years.
The rand has also been assisted by the weakening US dollar during 2025, with the dollar index experiencing its steepest annual loss in eight years. The world’s dominant currency was weighed down by economic policy uncertainty following a raft of new tariffs on imports and a substantial narrowing of its yield advantage over peers. Compared to the yield on long-term German bonds, US bonds have lost almost 100 basis points since January 2025. The latter is a deterrent to investor appetite that is widely expected to gain traction with further cuts in the Federal Reserve’s bank rate in 2026.
The strong rand has played its part in keeping inflation in check, but it has a predictable, detrimental impact on South Africa’s manufacturing sector, due to cheaper imports.
Construction sector on the mend
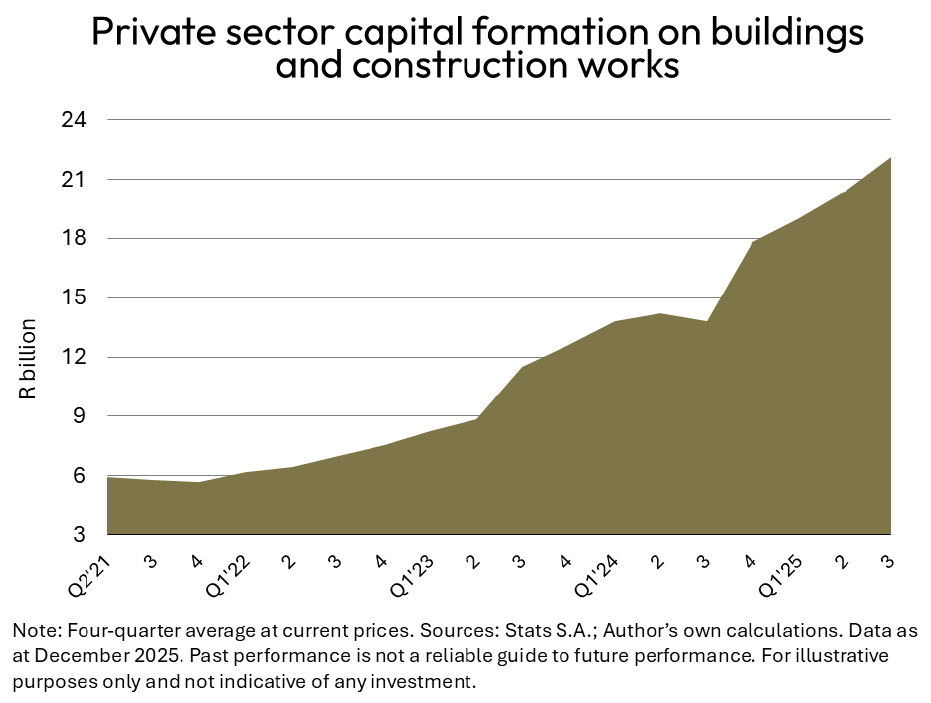
Private sector capital expenditure on buildings and construction works reacted positively to the lower interest rates that kicked in during the third quarter of 2024. The lower cost of capital has predictably incentivised investment in construction activity, with an outstanding year-on- year increase of 90% having been recorded during the four quarters between October 2024 and September 2025.
The latest data on capital expenditure by selected enterprises in the private sector (compiled by Statistics South Africa) are aligned with the trend of the Afrimat Construction Index (ACI) for the third quarter of 2025. The ACI is a composite index of the level of activity within the building and construction sectors, and the third quarter reading was more than 10% higher than the previous quarter, boosted by significant increases in the values of building plans passed and retail trade sales of hardware.
Further progress is nevertheless required with the quest to raise the country’s ratio of capital formation to GDP from a level that is currently 50% below the global average. Hopefully, the National Treasury will utilise the 2026/27 National Budget to allow for substantial increases in capital formation by the public sector, as the country remains in dire need of repairs and expansion to its infrastructure, especially roads, water and sewage.
Solar PV powers ahead
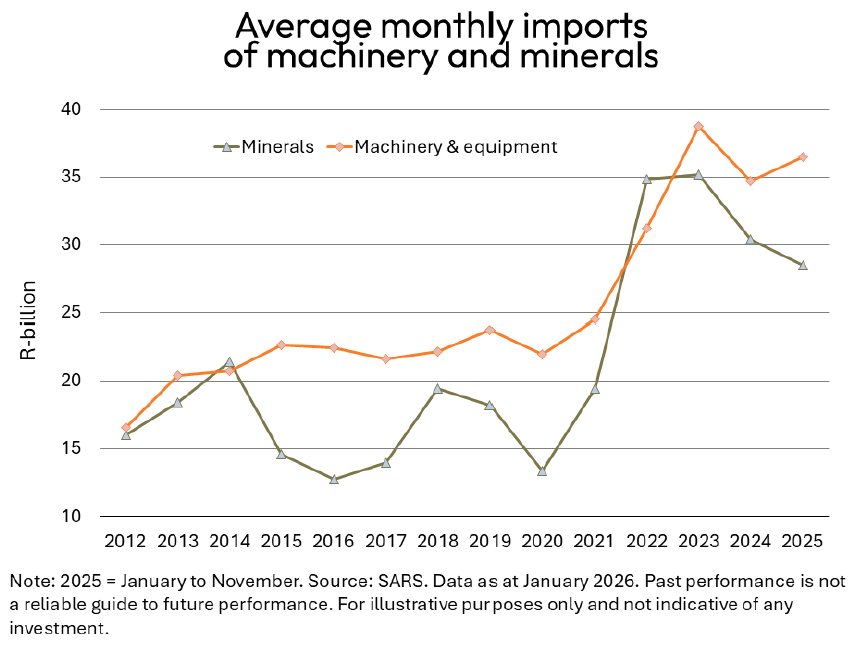
International trade data on machinery and equipment imports reveal a structural increase since the country’s shift to accommodate meaningful private sector participation in renewable energy generation. Energy-related equipment constitutes a significant slice of total machinery imports, especially solar panels, inverters and batteries.
Over the past four years, the average monthly value of machinery and equipment imports amounted to R35.3-billion – an increase of 53% over the figure for the preceding four years (2018 to 2021). In the process, the solar PV boom has also served to lessen reliance on mineral imports, which are dominated by oil, petrol and diesel.
According to Aninver Development Partners, South Africa is Africa’s undisputed solar power leader, accounting for nearly half of the continent’s installed solar capacity. Despite Africa possessing roughly 60% of the world’s prime solar resources, it only accounts for an estimated 3% of the continent’s electricity generation. Solar energy is therefore not only an environmental imperative but an obvious policy option for accelerating socio-economic development.
Thanks to public-private partnerships that have incentivised a strong private sector response, South Africa’s solar capacity has grown in leaps and bounds. According to the Africa Solar Industry Association’s (AFSIA) project database, South Africa currently has over 11.6 GW of operational solar, with more than 1.3 GW deployed in 2025 alone.
During 2025, the amount of rooftop photovoltaic (PV) solar installed in South Africa finally surpassed the total installed capacity of utility-scale solar farms that have contracted their capacity to Eskom. The rapid expansion of renewable energy generation is testimony to how rapidly capacity can scale when government and the private sector align.
Bumper tourism season
Tourists from all over the world have been converging on South Africa’s favourite tourist destinations, with Cape Town International Airport consolidating its position as the preferred point of entry. The latter phenomenon provides ample justification for the decision to build a new international airport in the Cape Winelands.
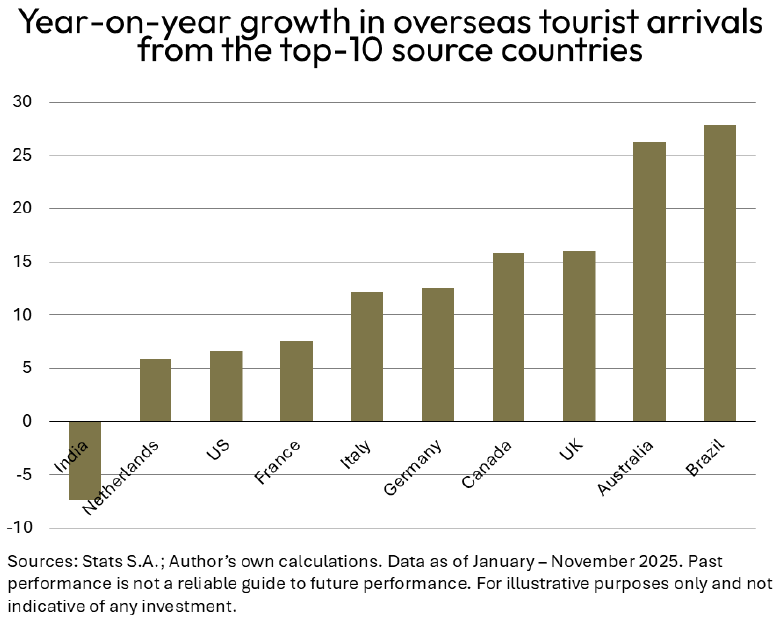
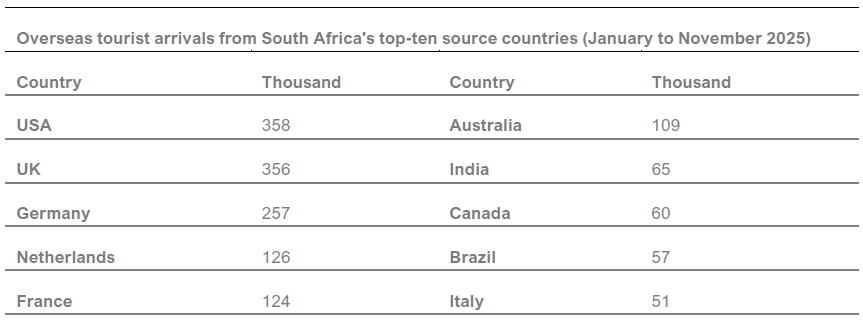
During October and November, the post-COVID recovery rate for overseas visitors to South Africa came within a whisker of a full recovery, reaching a level of 97% (using the number of tourists in the same quarter before the COVID-19 pandemic as the denominator). During the first eleven months of 2025, double-digit year-on-year growth rates were recorded for six of the top ten source countries for overseas tourists, with Brazil providing an example of the benefits that flow from implementing direct flights between the two countries.
An interesting feature of the trends in tourism arrivals (during the first eleven months of 2025) is the presence of only two BRICS members in the top-ten source countries, namely India and Brazil. The USA has managed to retain its number one position by the narrowest of margins, with the UK and Germany firmly in positions two and three. Europe continues to dominate the influx of overseas tourists to South Africa, accounting for almost 60% of the total during 2025 (year-to-date).
Sources
[1] Monitored by Currencies Direct & Exchange 4Free
Source: Stats SA. Data as at January – November 2025. Past performance is not a reliable guide to future performance. For illustrative purposes only.
About Dr Roelof Botha
A seasoned veteran of the economics fraternity in South Africa, Dr Botha has more than 50 years’ experience as a lecturer, financial editor of a daily newspaper, economic policy advisor at the National Treasury, columnist for various publications, researcher and a public speaker. Dr Botha received his early schooling in Sweden, Germany, The Netherlands, Christiana in the North West Province, as well as in Cape Town and Pretoria. Shorten with AI
His post-graduate qualifications include Honours and master’s degrees in economics (cum laude) at the University of Pretoria, and a Doctorate at the University of Johannesburg. He has authored more than 2000 articles, research papers and books, and has received the prestigious Finmedia Economist of the Year award, based on the accuracy of forecasts of key economic indicators.Shorten with AI
Dr Botha teaches economics (part-time) at the Gordon Institute of Business Science (GIBS) and is the Economic Advisor to the Optimum Financial Services Group.
Disclaimer
Although reasonable steps have been taken to ensure the validity and accuracy of the information in this document, Optimum Investment Group (OIG) does not accept any responsibility for any claim, damages, loss or expense, however, it arises, out of or in connection with the information in this document, whether by a client, investor or intermediary.
Optimum Investment Group (Pty) Ltd. Is an Authorised Financial Services Provider (43488).
All investments involve risk, including the potential loss of principal. There is no assurance that any financial strategy will be successful. OIG does not guarantee that the results of any advice, recommendations, or strategies will be achieved. Before making any investment decisions, customers should thoroughly review all relevant investment product documents and information. It is essential to assess whether an investment aligns with your financial situation, objectives, and risk profile.
This document may contain forward-looking statements identified by terms such as “expects,” “anticipates,” “believes,” “estimates,” “forecasts,” and similar expressions. These statements involve risks, uncertainties, and other factors that could cause actual results to differ materially from those projected. OIG is not responsible for any trading decisions, damages, or other losses resulting from the use of the information, data, analyses, or opinions provided.
Past performance does not guarantee future results. Neither diversification nor asset allocation ensures a profit or protects against a loss.
The information, data, analyses, and opinions presented herein are for informational purposes only and do not constitute investment advice or an offer to buy or sell any security. References to specific securities or investment options should not be considered an offer to purchase or sell those investments. The performance data shown reflects past performance and is not indicative of future results.
The opinions expressed are those of OIG as of the date written, are subject to change without notice, and do not constitute investment advice.